Statistics
2015 Health Manpower Survey
Summary of the Characteristics of Chiropractors
I. Chiropractors Covered
1.1 The chiropractors covered in the 2015 HMS were chiropractors registered with the Chiropractors Council under the Chiropractors Registration Ordinance (Chapter 428) as at the survey reference date - 31.8.2015.
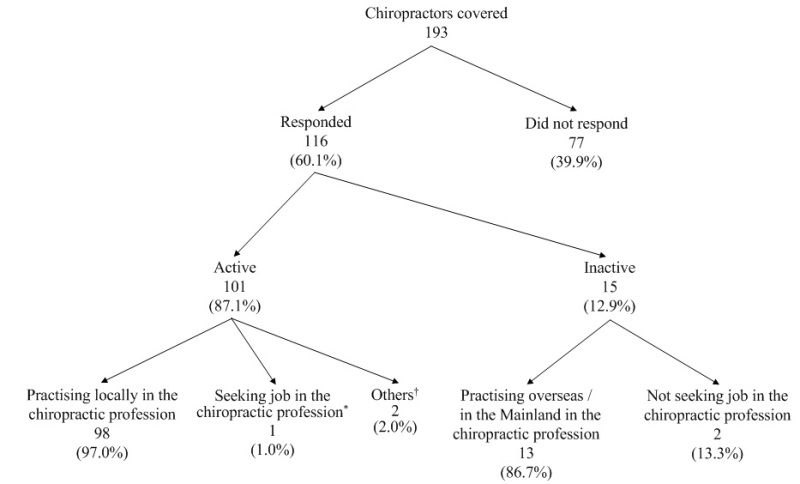
1.2 The number of chiropractors covered was 193.
1.3 Of the 193 chiropractors covered, 116 responded to the survey, giving an overall response rate of 60.1%. Among the respondents, 101 (87.1%) were economically active 1,2 (active) in the local chiropractic profession as at 31.8.2015 and 15 (12.9%) were economically inactive 1,3 (inactive) (Chart A) .
1.4 Of the 15 inactive chiropractors, 13 (86.7%) reported practising overseas / in the Mainland and two (13.3%) were not seeking job in the local chiropractic profession during the 30 days before the survey (Chart A) .
1.5 Of the 98 active chiropractors enumerated who were practising in the local chiropractic profession, 69 (70.4%) were male and 29 (29.6%) were female, giving an overall sex ratio (males per 100 females) of 238. Two registered chiropractors did not indicate their age and the median age of the remaining 96 active chiropractors enumerated was 41.0 years. The median age of the active female chiropractors enumerated was 32.0 years and that of their male counterparts was 43.0 years.
1.6 The responding active chiropractors enumerated were requested to indicate the characteristics of their main jobs 4 . Distribution of the main job by sector showed that all the 98 active chiropractors enumerated were working in the private sector. Among them, the largest proportion (54.1%) were in group practice and the remaining 45.9% were in solo practice.
1.7 The median age of the active chiropractors enumerated was 49.5 years for those working in solo practice and 35.5 years for those working in group practice.
1.8 Of the 98 active chiropractors enumerated, 99.0% spent most of their working time on service in chiropractic, and 1.0% spent most of their working time on administration / management.
1 In the survey, the criteria used in defining economically active / inactive followed those recommended by the International Labour Organization, which are also being used by the Census and Statistics Department in Hong Kong.
2 "Economically active" chiropractors comprised all "employed" and "unemployed" chiropractors. "Employed" chiropractors referred to those chiropractors practising in the chiropractic profession in Hong Kong during the survey period, while "unemployed" chiropractors referred to those chiropractors who (a) were not practising in the local chiropractic profession during the survey period; (b) had been available for work during the seven days before the survey; and (c) had sought work in the chiropractic profession during the 30 days before the survey.
3 "Economically inactive" chiropractors comprised the chiropractors who were not practising in the chiropractic profession in Hong Kong during the survey period, but excluding those who had been on leave during the survey period and who were "economically active" but "unemployed".
4 Main jobs referred to the jobs in which the chiropractors had spent most of their working time.
Chart A : Activity Status of Chiropractors Covered

| Notes﹕ | * | Figure refers to the number of responding chiropractor who (a) was not practising in the chiropractic profession in Hong Kong during the survey period; (b) had been available for work in the local chiropractic profession during the seven days before the survey; and (c) had sought work in the local chiropractic profession during the 30 days before the survey. |
| † | Figure refers to the number of responding chiropractors who (a) were not practising in the chiropractors profession in Hong Kong during the survey period; (b) had not been available for work during the seven days before the survey; and (c) was starting business at subsequent date or waiting to take up a new job in the local chiropractic profession during the 30 days before the survey. |
1.9 The median number of hours of work (excluding meal breaks) per week of the 98 active chiropractors enumerated was 43.0 hours. Among them, 92 (93.9%) were not required to undertake on-call duty (excluding normal duty) and six (6.1%) were required to undertake on-call duty (excluding normal duty), with a median of 6.5 hours of on-call duty per week.
1.10 Regarding the average number of consultations / patients encountered per working day, 39.8% of the active chiropractors enumerated reported to have a range of 11 to 20, 30.6% reported to have 10 or below, 18.4% reported to have 21 to 30 and 11.2% reported to have 31 or above.
1.11 Of the 98 active chiropractors enumerated, 70.4% held Doctoral Degree, 21.4% held Bachelor’s Degree and 8.2% held Master’s Degree as their basic qualifications.
1.12 Of the 98 active chiropractors enumerated, 54 (55.1%) received / were receiving additional training and 44 (44.9%) did not receive any additional training. Of the 54 active chiropractors enumerated with additional training, 24 (44.4%) held Certificate, nine (16.7%) held Master’s Degree and six (11.1%) held Doctoral Degree as the highest qualification.
1.13 Of the 54 active chiropractors enumerated who received / were receiving additional training, 18 (33.3%) were trained / receiving training in one field. Among them, 27.8% each were trained / receiving additional training in chiropractic and acupuncture, 11.1% in sport injuries, and 5.6% each in magnetic resonance imaging, musculoskeletal diseases management, neurology, nutrition, occupational and industrial health, and pedorthic.
1.14 Among the 54 active chiropractors enumerated who received / were receiving additional training, some of them selected more than one field of additional training. The total number of count of active chiropractors enumerated who received / were receiving additional training was 172, in which 19.8% were trained in chiropractic, 12.8% in both acupuncture and sports injuries and 11.0% in rehabilitation.
II. Trend Analysis
2.1 Comparison of findings of the 2015 HMS with those surveys conducted before 2004 should be cautious as the survey methods and reference date had been changed.
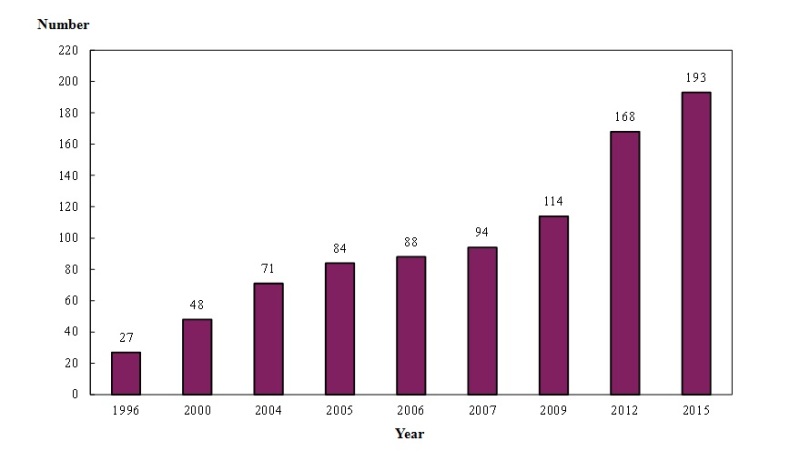
2.2 With the enactment of the Chiropractors Registration (Fees) Regulation and the Chiropractors (Registration and Disciplinary Procedure) Rules, Chapter 428 subsidiary legislations A and B, Laws of Hong Kong, registration of the profession of chiropractors commenced on 1 September 2001. Relevant provisions in the Chiropractors Registration Ordinance which prohibit practice of chiropractic by unregistered persons has come into effect on 13 February 2003. Between 1996 and 2015, the number of chiropractors increased from 27 to 193. (Chart B) .
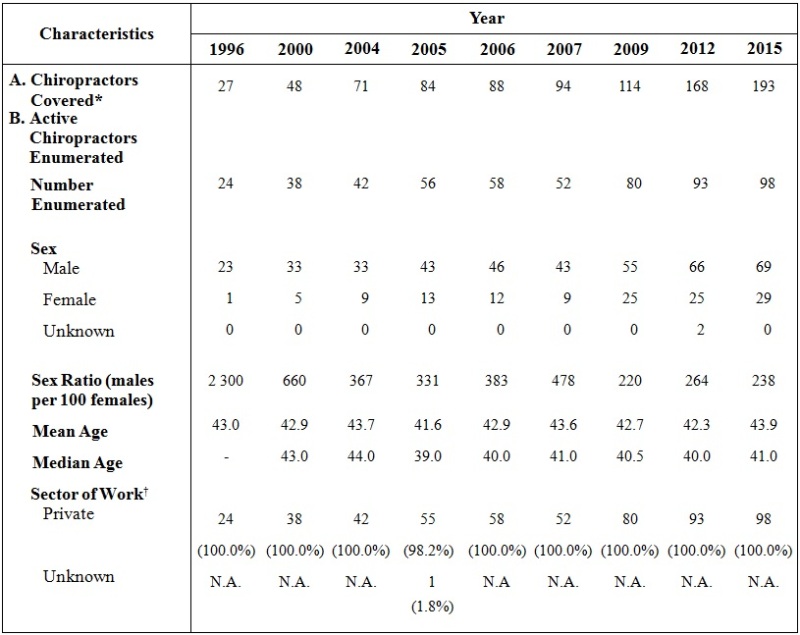
2.3 An increasing trend was observed in the proportion of female chiropractors, as indicated by the decrease of sex ratio (males per 100 females) from 2 300 in 1996 to 238 in 2015 (Table A) .
2.4 The mean age of the active chiropractors enumerated remained static at 41.6 years to 43.9 years between 1996 and 2015.
2.5 Except one active chiropractor enumerated who did not indicate the sector of work in the 2005 HMS, all the remaining active chiropractors enumerated from 1996 to 2015 were found practising in private sector (Table A) .
Chart B : Number of Chiropractors Covered by Year (1996, 2000, 2004, 2005, 2006, 2007, 2009, 2012 and 2015)

| Note: | Figures of 1996 and 2000 refer to the number of chiropractors reported by the responding institutions as at the 1st July of the respective years, whereas figures of 2004 to 2007, 2009, 2012 and 2015 refer to the number of chiropractors registered with the Chiropractors Council as at the 31st August of the respective years. |
Table A : Selected Characteristics of Active Chiropractors Enumerated (1996, 2000, 2004, 2005 ,2006, 2007, 2009, 2012 and 2015)

| Notes﹕ | * | Figures of 1996 and 2000 refer to the number of chiropractors reported by the responding institutions as at the 1st July of the respective years, whereas the figures of 2004 to 2007, 2009, 2012 and 2015 refer to the number of chiropractors registered with the Chiropractors Council as at the 31st August of the respective years. |
| † | In 2004 to 2007, 2009, 2012 and 2015, the sector refers to the sector of main job. | |
| As the number of chiropractors involved was very small, the corresponding statistics should be interpreted with caution. | ||
| ‘-’ Not available | ||
| N.A. Not applicable |